Tableau | AI & ML | Tool strategy | Data visualisation
 Claude's dashboard feature could let you vibe code Tableau data apps
Claude just teased a dashboarding feature that might let anyone vibe code apps on top of your trusted Tableau data — and that changes everything.
- Claude's new dashboarding feature already supports live connections to BI tools like Amplitude, Grafana, Hex, MixPanel, Omni, PostHog and Sigma, with Looker, Monday.com and Tableau listed as coming soon
- Claude's demo dashboard is a native JSX file built with HTML, suggesting it can be published straight into a BI ecosystem rather than just embedded
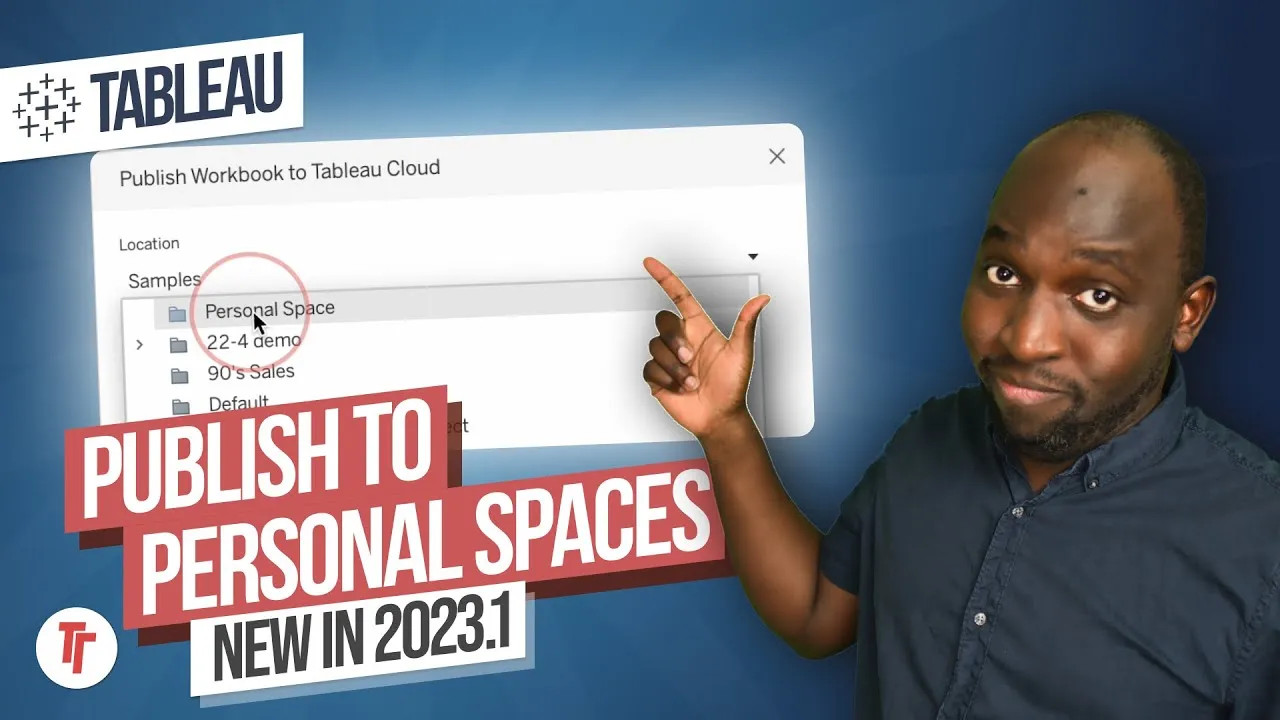
- The 'publish to personal space' detail hints that Tableau may let vibe-coded, non-native assets sit inside the Tableau ecosystem as long as they're built on trusted published data sources
- VizQL Data Service and composable data sources could be the plumbing that lets Claude-built apps talk to multiple Tableau data sources at once
- A shared design.md style brand/design standard could let vibe-coded dashboards stay close to brand and best-practice standards automatically
Claude's new dashboarding feature lists Tableau as 'coming soon' alongside other BI tools, and the clues in the demo suggest you'll soon be able to vibe code custom data apps on top of trusted Tableau data sources and publish them straight into the Tableau ecosystem.
Tim had just covered Tableau 26.3's data apps feature and VizQL Data Service without fully connecting to why it mattered. Then Claude announced a dashboarding capability that name-checks Tableau as an upcoming integration, which reframes that earlier feature.
- Claude's dashboard announcement names BI tools 0:45
Claude's new dashboarding capability already connects live to tools like Amplitude, Grafana, Hex, MixPanel, Omni and Sigma, letting you pick up analysis straight from those sources. Looker, Monday.com and Tableau are listed as coming soon, which lines up with Tableau 26.3 still being in beta.
- The demo hints at a Tableau data source 1:39
Claude's example dashboard is a native JSX file built in HTML rather than an embed, and it references VizQL Data Service. The data source isn't shown, but the plumbing strongly implies it's meant to sit on top of a published Tableau data source rather than standalone data.
My video on: VizQL Data Service - Weighing it against Salesforce's own demo 3:07
At Dreamforce, Salesforce showed a similar data app landing inside Tableau Next, which made sense because that's a web platform used to embedding iframes. Seeing an equivalent idea appear independently via Claude, aimed at desktop rather than just the web, makes the pattern more believable rather than a one-off.
My video on: Tableau Next - Personal spaces could be the governance answer 4:05
The detail of publishing to a 'personal space' matters: these are private to the owner, so a vibe-coded app built on a trusted published source stays governed without being exposed org-wide. This is the mechanism that could let non-native assets sit safely inside the Tableau ecosystem.
My video on: Personal spaces - Why this could end manual dashboard building 5:03
If anyone can vibe code a working app on top of governed data, hand-building dashboards stops being the valuable skill. The better investment becomes defining a strong, metric-focused data model that other people's vibe-coded apps can safely sit on top of.
- A design.md file to keep vibe coding on-brand 5:39
One way to keep vibe-coded outputs consistent is to give people a markdown file that codifies your design standards and visualisation best practice. Baking that into the prompt lets anyone generate dashboards that are close to brand-perfect by default, without needing design expertise themselves.
- Composable data sources as the connective tissue 6:06
It's not yet confirmed whether a vibe-coded app could pull from multiple published data sources at once, but VizQL Data Service's composable data sources look like the feature that would make that possible.
My video on: Composable data sources - What to expect as 26.3 lands 6:44
The Claude dashboarding feature is already live for other BI platforms today; the Tableau connection is expected later this month as part of 26.3. Tim flags this as likely the first thing he'll cover when that release lands.
- This is speculation built from reading between the lines of a product announcement — Tim is explicit that he's 'pulling at strings' and could be wrong.
- The actual data source behind Claude's demo dashboard was never shown or confirmed as Tableau.
- Whether composable data sources can support an app querying multiple published sources at once is unconfirmed.
Worth watching if you're planning a Tableau data/governance strategy now, since investing in clean, well-modelled published data sources may matter more going forward than building more dashboards by hand.
How this Rollup was made provenance & method
A Rollup is drafted by AI from the video's transcript, then reviewed and edited by Tim. Everything used to produce this one is listed below (the model, the exact prompt, and the source video), so the process is transparent and reproducible.
- Transcription
- On-device: NVIDIA Parakeet v3 for recent videos, OpenAI Whisper large-v3 for earlier ones. The transcript never leaves the machine or gets published.
- Drafting
- Claude Sonnet 5 in the cloud, from that transcript.
- Prompt
- The exact Rollup prompt (v3) , the full system prompt, unedited.
- Source video
- Watch on YouTube
- Drafted
- 10 October 2026 at 14:05
- Reviewed & edited
- 10 October 2026 at 14:06 · by Tim Ngwena
Model + prompt + video is everything you'd need to recreate a Rollup like this yourself. The one thing we don't share is the transcript.
Rights. The video and its transcript are the property of TN Media Ltd. Unauthorised use or download is prohibited. © TN Media Ltd.