0:00Kirk, you're back.
0:02Tim, it's good to be here.
0:06We've got something exciting to go through today.
0:09Composable data sources.
0:10Is that right?
0:12That is correct.
0:13We've been waiting a long time for this feature.
0:16Okay, okay.
0:16I I have to lead with this, which is I think I dissed
0:20Tableau during the Tableau conference keynote saying they first talked about this in 2024 and I guessed that it might come out in 26.
0:302 and I think we're nearing
0:32uh that release which is why you're here.
0:35Um it's also worth highlighting that we have previously done a video on uh the data model we in fact call it the data model masterclass
0:43It's been watched by thousands of people.
0:45I don't know what the most recent view count is, but I know it's in the high thousands at this rate and this is intended as a follow-on from that video.
0:54So if you're watching this for the first time, you don't know what the data model is.
0:57We have some homework for you to do.
0:59It's an hour and a half, but we think it's the best hour and a half on the data model that you'll ever watch and it will set you up perfectly for this video.
1:06Is that fair, Cook?
1:08That's perfect.
1:08And last I check was ninety one hundred, so let's Oh there we go.
1:15Not that I'm composed.
1:16Of course you know the number.
1:18So maybe by the time by the time we launch this video, um we'll be at ten thousand.
1:23How about that?
1:24Let's let's push for that at least.
1:25Yeah, let's push for that.
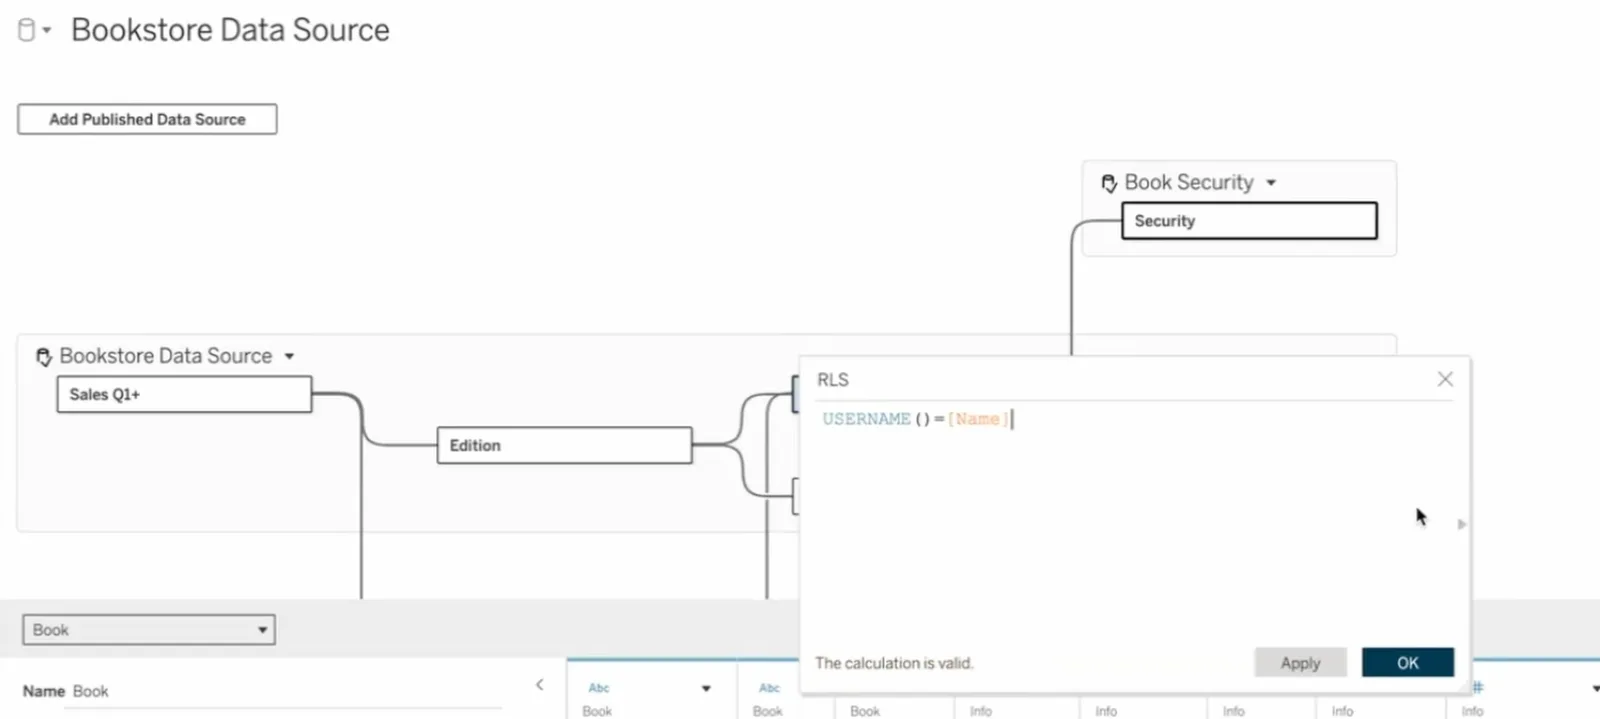
1:26I like that ten thousand.
1:27Okay.
1:31Smash that like subscribe button.
1:33You've got a great channel too, I should add.
1:35We're gonna be co labbing on this feature so you'll see
1:38both our channel names in here.
1:40Please subscribe to both of us.
1:42It really helps us out.
1:43And Kirk, I love having you on here because I know that when we do something like this it's it's really detailed.
1:49It's really deep.
1:50And I always learn something and I know my audience always learns something incredibly new.
1:55Um if we step back, can you c explain what composable means just out of the gate?
2:02Just so we can sort of contextualize the term then.
2:04contextualize the feature.
2:06Yeah, because a lot of people are calling it compostable data sources, but I don't think they break down.
2:11I don't think they break down.
2:13They're organic.
2:15They're kind of the opposite of that.
2:17Um so um yeah, sure.
2:19Like in our video when we talked about building data models in Tableau, we built a data model in Tableau Desktop.
2:26We could have come to the web and went new published data source, right?
2:30from either server or cloud.
2:32Um uh but but the the issue with that is i if you're an individual analyst there's no issue with it.
2:38That's the way you would do it.
2:39Composable data sources
2:41might not even be exciting to you.
2:44But what happens in enterprise environments, which a lot of people watching will probably get is
2:49Somebody already built a published data source and you don't own that published data source and you want to say just add another table to it.
2:57Um your only choice is today or you have to go ask them to add your table to it
3:01Or you go, oh, I have to rebuild that, dragging and dropping, like you know, all your new uh and and then that causes an explosion, right?
3:10And that explosion let's say talk about that explosion super quick without AI
3:14Um without AI, it's still a mess.
3:16Do you know what I mean?
3:17People don't know which one to use.
3:18Um with AI, it's gonna be a lot of chatty stuff.
3:21And I'll give you a really we'll get into this a lot more, but imagine now if instead
3:26you published maybe even atomic tables so you could publish fact tables, ag tables, and ag tables we should get into would be fun.
3:34Um and dimension tables, however you want to think about it.
3:37then if you had like commentary in it, such a terrible term, but like in Tableau, you had metadata to describe the field, then
3:45um any author but also any AI client you point at it, like that only has to be defined once instead of redefined over and over and over again in every single data source.
3:55So the term compose to wrap this up, I think, is now you can publish tables or smaller data sources and you can let analysts compose their own data source is the way I think about it.
4:06So I'm gonna challenge that very briefly before we get into it, which is um a Tableau conference.
4:12Tableau talked about this idea of
4:14the world's largest source of semantic models being the Tableau ecosystem itself.
4:20And if we dig into that, what they really mean is that hey, every single published data source
4:25is essentially a piece of semantic information.
4:29And I think what you kind of just explained is how they see this sort of semantic vision coming together, which is
4:36rather than going to define it in in in a warehouse or whatever.
4:39Actually you've already started that activity, you have done it for the last twenty years.
4:43The sort of final hurdle of that is actually just letting them talk to each other.
4:47Is that is that a fair sort of way of linking
4:50Table sort of idea with what you've explained, right?
4:53Yep.
4:53And even today we'll look at because these demos are always hard to do with a true data source because we have to use fake data anyway.
5:00But um we will use I I will I will show how to use Rollerful Security and we can update live uh Google Sheet
5:08And that will automatically update a data source, you know, in Tableau speak, a published data source, um, that we didn't touch.
5:15We just added the row level security onto it.
5:18Oh wow.
5:19Great.
5:19Okay.
5:20Amazing, amazing.
5:21I think in another video we'll we'll challenge that perspective because I think that is one of the biggest, let's say, hurdles.
5:27in the data world to see Tableau as a semantic solution in that sense, right?
5:31Like it's it's people have never seen their published data sources as as a semantic model in in that sense.
5:37But they strictly are by definition, right?
5:39And so um I think this feature really realizes
5:42Well it's super interesting because they can be or they cannot be, right?
5:45Like people could model you know a one big table uh point directly to that table or view.
5:51Bring it in the tableau, no commentary, joins all pre-done, is it a semantic model?
5:56Right?
5:57But the exact same technology
5:59you um bringing in tables that they're natural grain, giving the proper level of commentary.
6:03Now it's a semantic model.
6:05So part of the problem for sure is it relies on the person creating it.
6:10to make it a proper semantic model or not.
6:12I think.
6:15Show me how it works.
6:16I'm I'm I'm I'm all ears.
6:18Yeah, so
6:19Again, we're referring back to this bookshop data source, right?
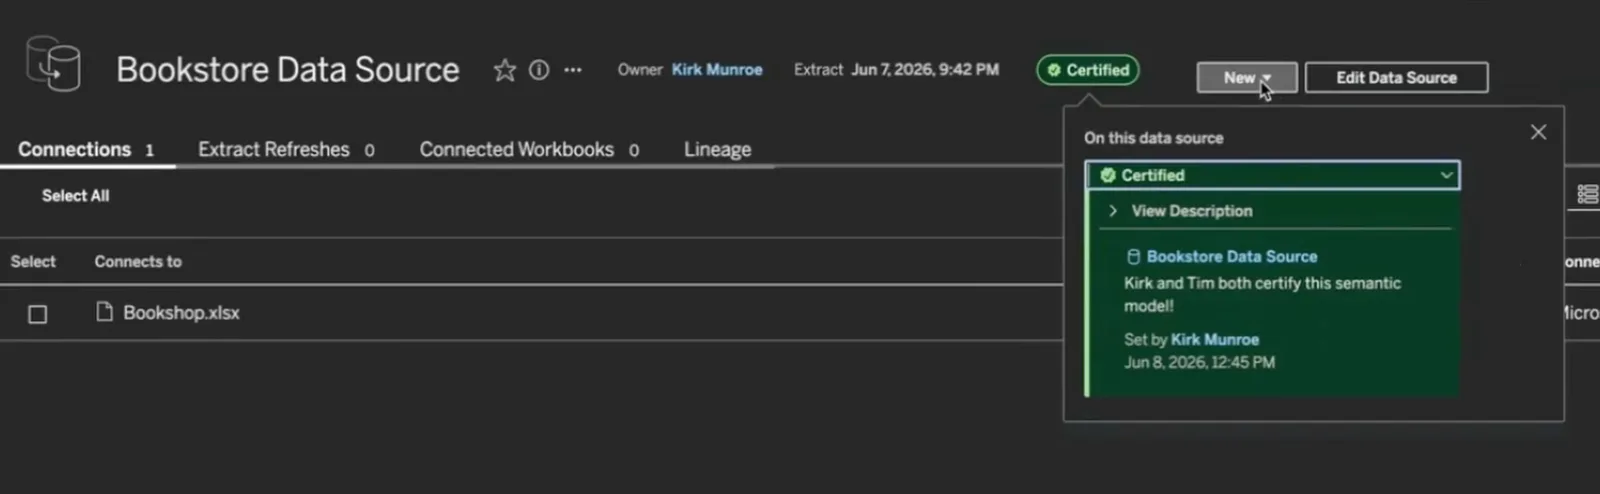
6:22So this isn't the one you'll notice I've got this certified data source.
6:26So if I click on it it says
6:28Yeah, uh Kirk and Tim both certified the semantic model.
6:31So this one clearly we think of as but anyway.
6:33Um I'm gonna create a workbook using this.
6:35So this isn't the full semantic
6:38m model we made last time or data model we made last time.
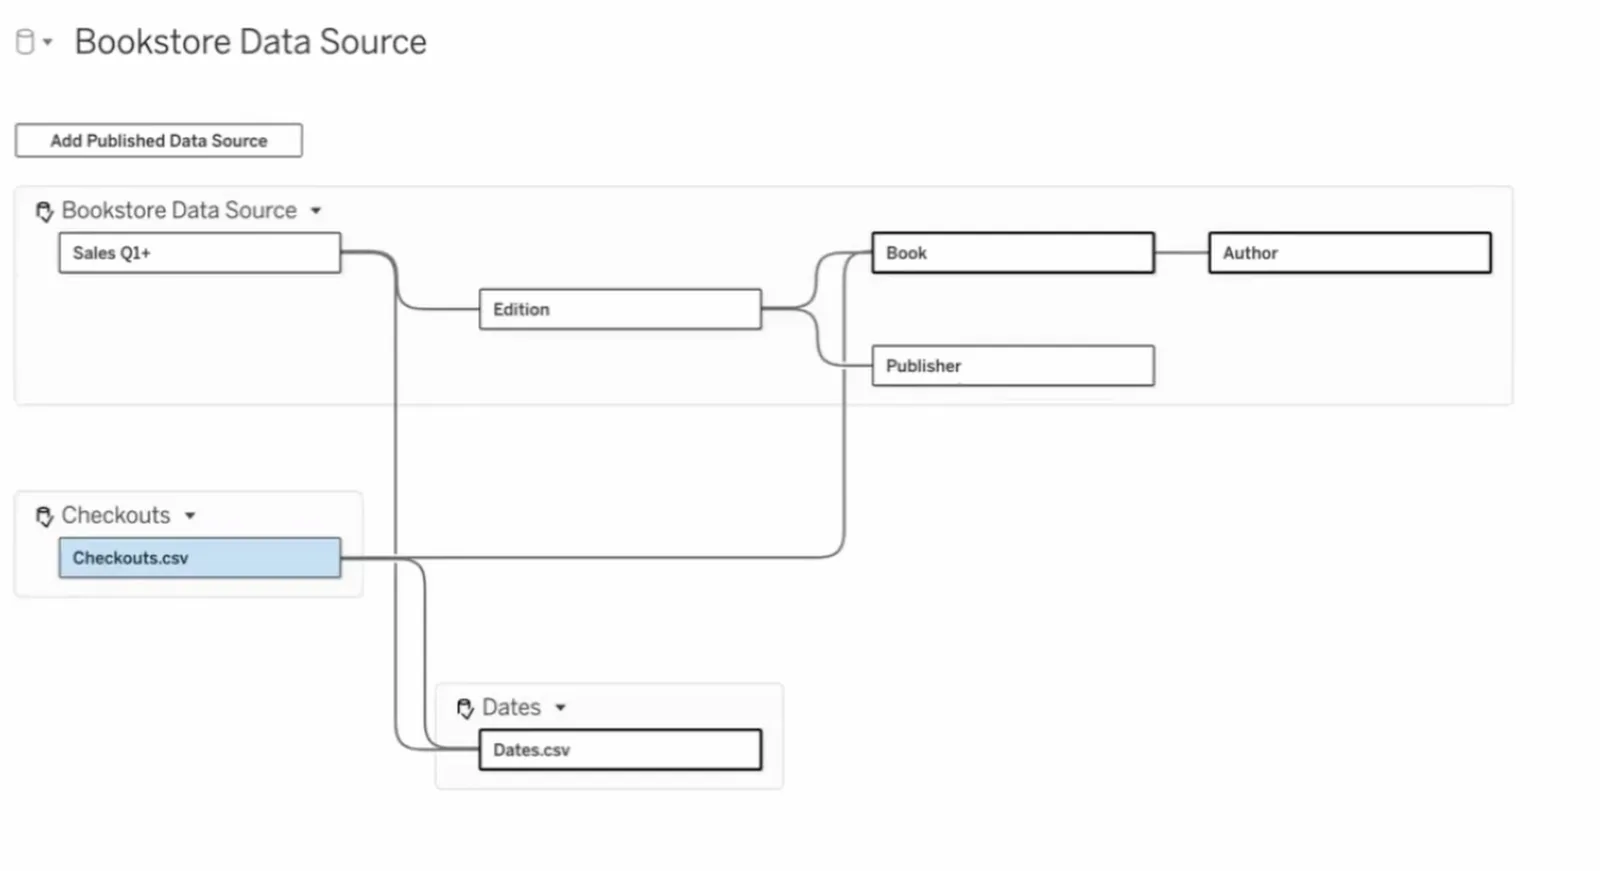
6:42What it is, if we come and look at it, is it's um imagine remember we talked about we have we're a book seller who we sell books
6:52And then we also um people can check the books out.
6:55So whether it's a library or like Audible doesn't super matter, but it's that kind of metaphor in this model.
7:01But let's say that um
7:03that we use some other platform to do that and we only get the data once a month on books that were checked out.
7:10So w they're not really in
7:12like our data model.
7:13So we build this data model though.
7:15One thing I did which you can't see here, I could go back to the data model.
7:19I actually took
7:20uh info to get like genres.
7:23An example, and I joined it one-to-one inside this book.
7:26But now it becomes a logical table, right?
7:28So um we can do some pretty cool things with this um
7:32with this, like on our own, right?
7:33Like there's only one year of data in this, you know, it's pretty limited in the years twenty one ninety three or whatever.
7:39But people can go download it.
7:40We'll put the link down there so people can do that.
7:42But imagine if I we wanted to s say sales, like we could go sales date
7:47um by month, you know, continuously and then just do a count of sales and then we could take something like, you know, we could do author, whatever we wanted to, but let's take uh
7:58Let's take um genre and put it on or something, right?
8:02Um so we could take that and put it on color.
8:05Not that, you know, maybe doesn't follow visual best practices, but we get an idea, you know what I mean?
8:10Like
8:10Sci-fi pops the most, mystery, children.
8:13We did this in the other video.
8:15Um but now imagine what if we think about so there's two things we can do with composable data sources.
8:22And let me say that
8:23Uh I'll admit what I was pretty blown away by um in when they did this is it's the
8:31First time in a while the tableau has given us a UX that
8:39is true to what Tableau was from day one, which was this whole, you know, in the flow, get data, need data, whatever.
8:45Right?
8:45So imagine how
8:47Terribly out of the flow this would be if I wanted to bring in um say for example checkouts to this, right?
8:54Like what I would have to do is I couldn't come back here in the past
8:58and add checkouts, I would have to kinda come back here, right?
9:02I'd have to edit this data source.
9:05I'd have to go in and then add
9:08Uh checkouts to the existing data source, right?
9:11Yeah.
9:11But I don't want to do that.
9:12I might mess up other people who are using it.
9:14There you can see book is
9:16a join there, right?
9:17Um but so in s but what they let you do here, and I was blown away by this, I wasn't expecting it.
9:23I thought at least I could go add other data sources.
9:27um to to that data source to compose a new data source.
9:31But what they almost have is they gave us embedding
9:35as an as a choice.
9:36We can do that.
9:37We can't do what I expected.
9:38But they gave us embedding as a choice.
9:40So in the flow of our work, let's say one of the questions we answered in the other one
9:45And then what I challenge you to do with this data set with Claude was, you know, what's the relationship to checkouts, right?
9:52So I can come back here
9:54almost like in embedded for people who know then tableau I can say you'll see now I have this or I will have I should mention I'm in a beta site here
10:02This is coming in the first kind of maintenance release, whatever they call it a twenty six dot two.
10:09Yeah, twenty what it's twenty six dot two dot one or probably.
10:14In like two months
10:15Yeah, yeah, yeah.
10:17So but what I can do is I've already published the only thing I did ahead of time is I took that table
10:24um that we had um you know of checkouts and I published it already as a data source.
10:29But I just went, bring it in, publish it as a data source.
10:32Yeah on its own.
10:33So now I can go like this, right?
10:36Uh imagine uh before I would have had to try to do a blend or something crazy, it just wouldn't have worked, right?
10:42So now I can just go checkout
10:44Right.
10:44And I can find that checkouts and what's pretty slick about this, um, even if this was uh uh was mo but
10:52I could drag from here to it, which I'll show you in a second, but in this case we we know this is um
11:00Uh this connects to books, right?
11:02Because remember it doesn't have additions, if anyone watched the other video would know that.
11:06And then so that's book ID to book ID
11:09Right.
11:09So but I'm in the flow of work.
11:11I don't have to publish anything.
11:13It publishes with this.
11:14But remember, I have all the
11:17like field commentary calculations, whatever from here.
11:21So I still have security.
11:23I have all my enterprise governance
11:25But the flexibility almost like I'm working with flat files and desktop, right?
11:29And and uh to show you one thing we would need now to compare dates, because this has dates trapped in it and this has dates trapped in it
11:37This is just a multi-fact thing.
11:39We would always want a date.
11:40Um so I would say you would always now just have a date published data source with like
11:46all the date dimensions you need in it, right?
11:48I think yeah let's take this one.
11:50But but just to show it doesn't have to be a base table, right?
11:54So now I have this dates table down here.
11:56I can go checkout to date like that.
12:01Right?
12:02And um if you remember this one was th this only has months in it, right?
12:06So I'm gonna go check out month to um month of date.
12:11So we can't go lower than
12:13uh month, but that's just the data, right?
12:15And then but we also want to be able to hang this off it.
12:18And this, if I wanted, I could still go all the way down to granular
12:23Because so now, yeah, so now we could do that thing that I think we did in our last video.
12:29Now what I could do is I could go
12:32Um so now we have checkouts is in our model.
12:34Oh, great thing about relationships, they never break what's existing.
12:37Like a join was the right.
12:40Yeah, so it's still working, but now we could go say so checkouts has this so we could create a calculated field now.
12:48For example
12:49And we could say take the number of checkouts, which we want to sum, and then um the other one's granular, so we can just do a row count, right?
12:57And Tableau gives us that automatically, like we saw in the last one.
13:01So this is like
13:02Checkout to sales ratio.
13:04Maybe it makes more sense the other way, but checkout to sales ratio and um now if we took
13:12Um if we took the checkout to sales ratio and we brought this on, and then now we're gonna want to bring dates on from
13:20the date dim table, because we it's effectively going to dynamically scaffold it, is what it's going to do, right?
13:26So then and same as we did there and then
13:29We could still go by uh we could still take genre and pull that in and put it on color, right?
13:35I might have done that calculation wrong.
13:37But anyway, you get the idea.
13:39No, yeah, it's super flexible still
13:41Yeah.
13:41Right, like how flexible that is, right?
13:43So that's that's one use case, but I think like um there's there's so many more
13:50use cases uh like other than that one like someone might catch what I did wrong there.
13:55At least that curve looks wrong to me.
13:56But but you know we could test it.
13:58You get the idea of how you know it it it dynamically brings
14:03It dynamically brings that data together for us.
14:06And when I publish the workbook, then I get this effectively embedded data source of published data sources.
14:14And you get this.
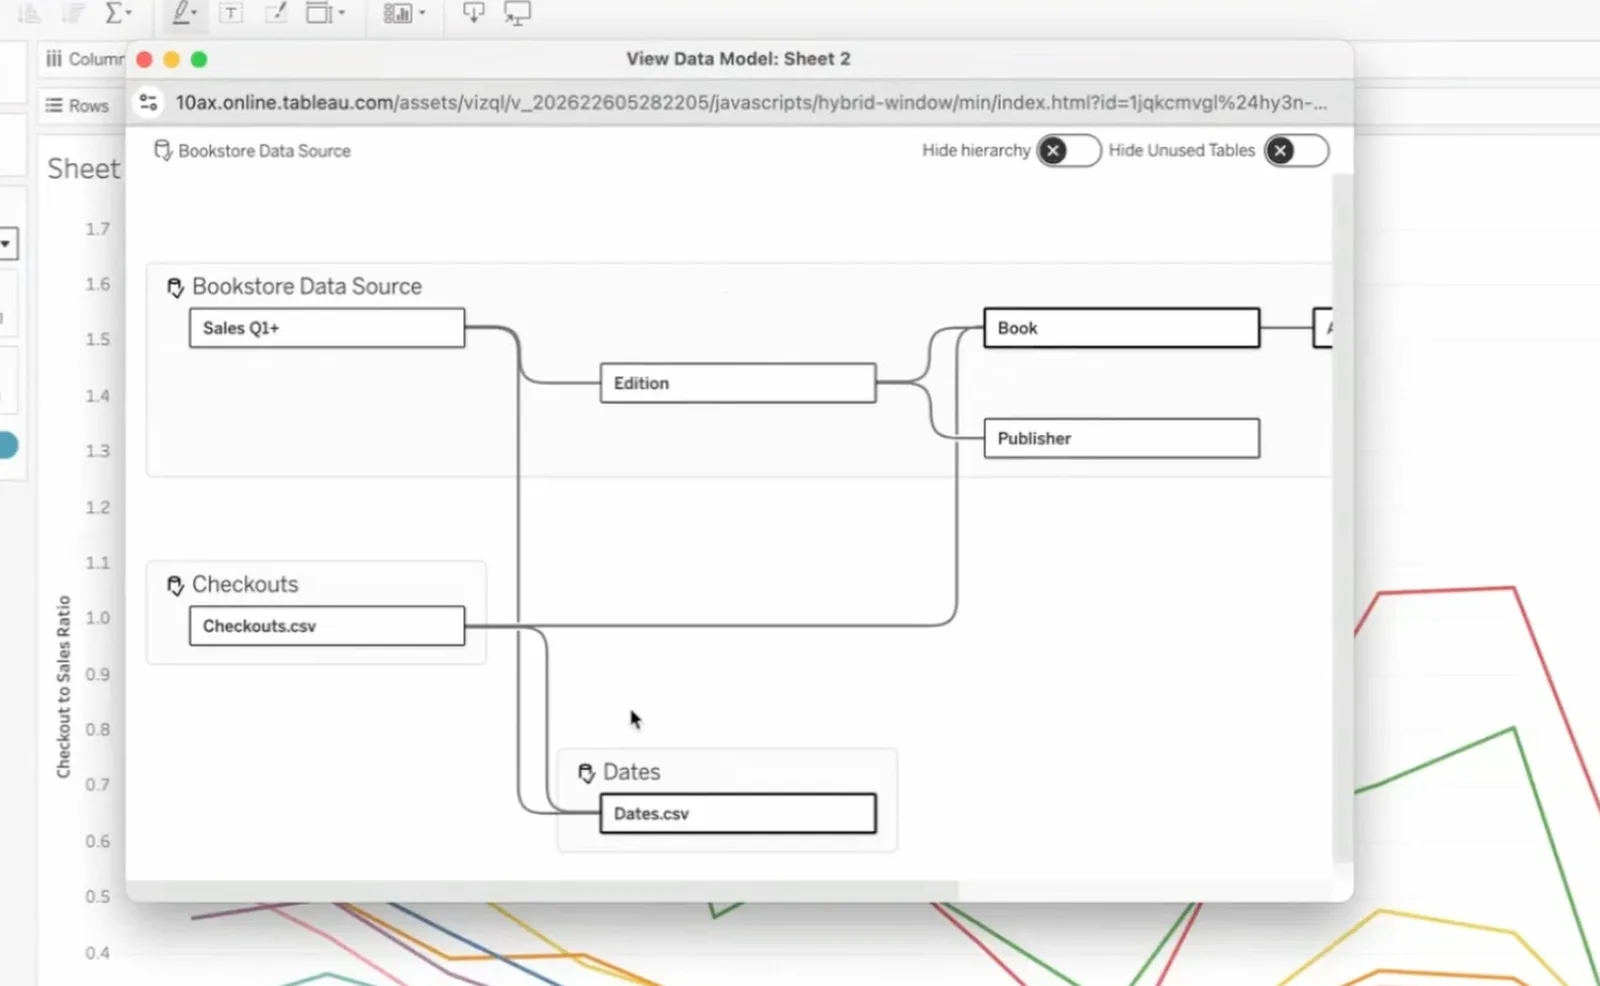
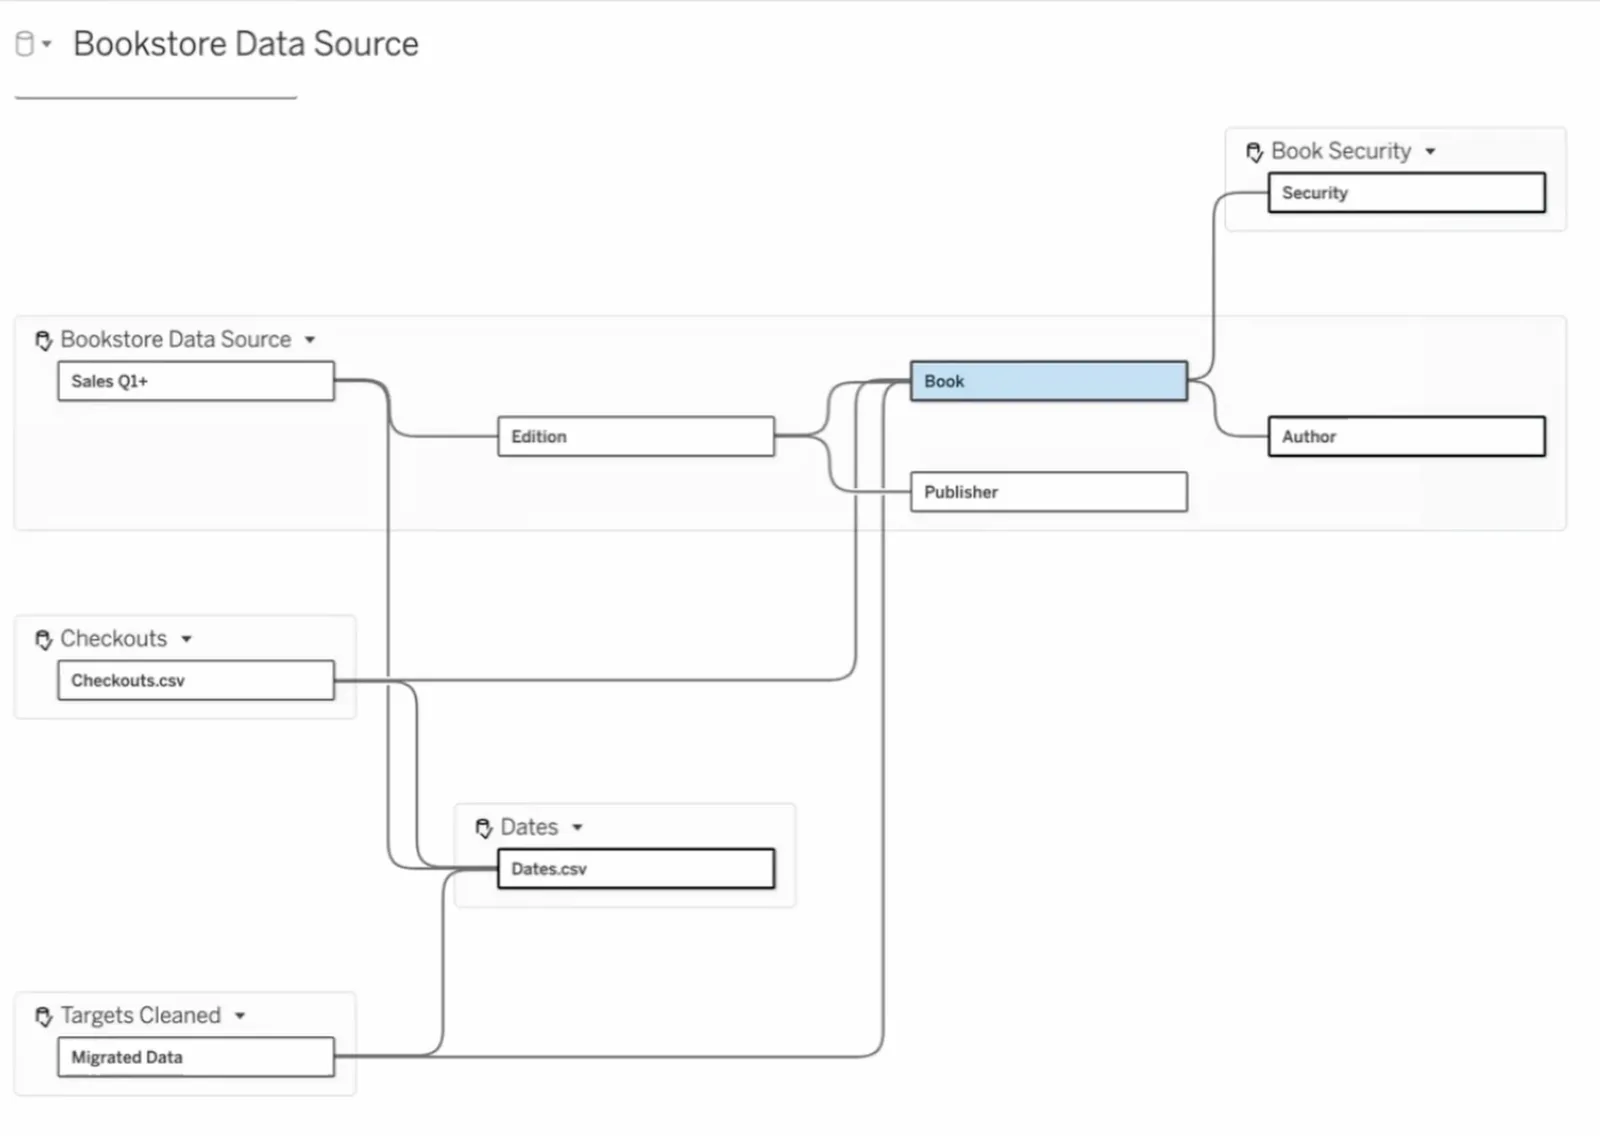
14:16And now there's kind there's kind of a new thing, remember, this is my favorite feature that no one knows about, which is I come to worksheet view data model.
14:26But now I can see two things.
14:27I can say only show the tables we're using, right?
14:30Which is not new.
14:31But I can also say I don't care about this hierarchy just like I want to see it as a model.
14:36Or I can see it that way.
14:39Can you go back to the connection window?
14:41I just want to ask a couple of questions.
14:43And actually I think it's a good place just to sit and take this feature in, if that makes sense.
14:49Because I think there's a couple of really profound things and you've just you've just actually shown and answered one of my questions, which is in essence, th like to your point, the way they've implemented this
15:02We can almost imagine that the boundaries for each of these don't exist, right?
15:06Which is what the Hyde hierarchy is actually doing.
15:09When you when you click on that, it just gets rid of those.
15:12So basically it's like you you you
15:14if you came to it and looked at it you wouldn't know that there's three published data sources in this connection.
15:19Right.
15:20So really kind of show showcasing the the power of semantics.
15:24The dates field could be like an organizational like date calendar or something like that.
15:29published up uh from Mortrix or whatever.
15:31Your checkouts can be uh you said row level security, you could have like any people that are allowed to see certain transactions.
15:37So
15:37A manager who's maybe managing a region could have that on checkout.
15:41Um but then because you've still got your main data source model, um, they could see still see the world of everything else, like the information about
15:49other books and other authors, but I only see the sales information from their checkout.
15:53Is that sort of what this suggests, if that makes sense if you've got that on checkouts?
15:58Yep.
15:59Yeah, depending on where you put the table for sure.
16:01Yeah, yeah the um yeah, yeah.
16:07Like how you build the query because of course um
16:10the the way the data model builds this out is going to have an effect on on on how that works.
16:15But it's really quite flexible.
16:17I think what you said at the beginning was what I thought was going to happen.
16:20that you had to have some sort of really strict relationship between these two things.
16:24But it's almost like actually, no, don't worry.
16:27Um we'll we'll just figure it out.
16:29And so I have one question which is
16:32What if I brought a data model that was as complex as bookstore in itself?
16:36Like how would I how would I relate them?
16:39So in this case I've brought in two separate one dates, one is checkouts.
16:42Let's say dates and checkouts were in one data source
16:46And I brought that in, would it force me to relate to one of those two in that logical model, if that makes sense
16:54Yeah, you were relate to a specific table within the logical model.
16:58I thought of that later that I should have brought one of those in.
17:00Maybe that'd be a follow up video, just to not be in people's mind too much.
17:04But yeah, yeah.
17:07But even from here, right, like I could
17:09Take that.
17:10I can't anymore, right?
17:12Uh but yeah, I could take that to publisher, see.
17:15That then leads to this question about multi-fact analysis, which is
17:20You know, you you could you could bring another model with which is sort of let's say checkout and date, but you could still create multiple relationships off that one model.
17:31So really abstract, hard to explain and visualize.
17:35Maybe I'll put a screenshot of what I'm thinking on uh in the edit.
17:38But yeah, um that's really powerful.
17:40I mean, is it's pretty profound.
17:43Um because
17:45uh literally just opens up the world to just rethinking how you organise your projects, your workbooks, um your data models.
17:54You don't have to be so constrained and think of these data models that do everything.
17:57Actually you can have
17:58like a central universe and then a bunch of ancillary bits of insight that can be brought in ad hoc for different types of analysis.
18:06It's it's really, really powerful.
18:08Uh yeah, it it yeah.
18:11Um and that's why I did say, you know, and what we both said they should watch the data modeling master class first or after because you really have to understand
18:21the heuristics of what Tableau's doing under the covers on this or like you could get yourself into a lot of trouble.
18:26Um now whether that's Tableau's fault or or not.
18:30I mean I think it's good.
18:31Like what it's a very
18:32Like we talked about, it's a it's a tableau's tableau ethos almost from day one, which is they assume you're smart and know what you're doing, right?
18:40For good or bad, right?
18:41Which um which I always find
18:43The opposite of Salesforce, which drives you through um uh drives you through Wizards for Everything where they assume you don't know what you're doing.
18:51Like it's very interesting and in and you know b and sometimes I wish this did
18:56A little better job for people explaining what's going on, but they're getting better.
19:00Like that view data model is really helpful, right?
19:04Yeah, but yeah, go ahead.
19:05I was gonna ask one last thing, like so
19:08How long do you think before Tableau suggesting other things you could bring into this based off like what other people are using?
19:16Because that's what Tableau semantics sort of
19:19is doing kind of today, right?
19:22So that's the next logical thing for me, which is how many data sources sit on Tableau servers that are just never used?
19:29But they were useful for one question
19:31They could be useful to someone else for some other reason.
19:34And now you have that sort of relationship.
19:37As soon as one person creates this relationship
19:39That to me is insight that can go to an AI model and inform the next ten analysts and say to them, hey, instead of writing out complex date fields, we have a date table over here, bring that in.
19:50It's better for this reason, right?
19:52Yeah, I I know they're thinking that way.
19:54I don't I don't know how close they are.
19:56I e the polls probably gonna be between how deep they go into stuff like the
20:01open semantic interchange and bringing in other people's metrics.
20:04Yes.
20:05Um or that.
20:06And I'm sure they'll trade off against each other.
20:08I'd rather see that personally, but I I don't see the whole market maybe.
20:12But yeah for sure.
20:13I want
20:15I've been saying for at least six months what I want is I want to have a conversation with an agent not to automatically build my model, but
20:23Um to help me with you know, I want to be able to drag that in before I bring dates.
20:28A simple example say, but say, how am I going to possibly compare checkouts
20:33to sales and they and it should be able to say, well I noticed they both have book, so clearly you want to create a relationship to book, but also now you're going to need a date table.
20:41I know there's one already published.
20:42Like to your exam like it should help with that, for sure.
20:45Like I and and I hope they go that way.
20:47Like because they n they're like ninety percent of the way there is the thing.
20:52Like this is the hard part.
20:54Right, like coming up with with like this modeling and the heuristic engine to do the work.
20:58'Cause um I know 'cause I've been playing with this which also could be another whole video, if you do this right, not only with like playing a lot with Claude asking questions against
21:08Through the Tableau MCP and set up directly against data.
21:11And not only are you more likely to get good answers, which of course they bring up all the time, like so they brought up during um True to the Core, but
21:18It takes the chattiness and tokens way down.
21:22Like even if you think you're gonna get the right answer either way, like it's gonna get you to the answer.
21:27So much quicker, right, because this is how you can effectively codify your business.
21:32And and across
21:34different data sources, which I want to kind of show with a simple example of throw level security, but you can imagine this could be Snowflake, this could be Databricks, you know, the
21:45Exactly.
21:46And some could be from external vendors.
21:48Like could be a data source connector.
21:50Could be a lot of people.
21:56Yeah, I just don't like big companies haven't standardized for the most part on one place to put all their data.
22:02So it's I think it's tricky for that's why I don't think that the um the database vendors like the snowflakes and
22:11Databricks are gonna completely own that.
22:13I'm skeptical of that.
22:14Right.
22:14So we should do a video about um ten things you didn't know you could do with this connection window.
22:20Yeah.
22:20Really
22:22Which and really it really kind of blow people's minds.
22:25Because it it I always say to people that it's really hard to communicate that Tableau
22:32Especially with VisQL data service, which is also like mind-bobbling to think that that can work on top of this in like some really sort of abstract way, right?
22:42creates probably the largest single developer surface to connect to 200 plus things, right?
22:50So if I just sort of explain this very briefly
22:53Visual Data Service is an API that allows you to query any data source in the Tableau ecosystem.
22:58It's an API, so developers can use it.
23:00The value that Tableau has here is it can connect to many databases and
23:06other data sources through the re uh through the new REST API connector.
23:11So in essence you've got one touch point to connect to virtually any data source in the world, which is which is wild
23:19And then on top of that, you've got things like analytics extensions, which then allow you to do things like you could run uh machine learning models in the analytics extension to compute against this and this composable data source
23:33is like perfect because one of these um data sources could be an analytics extension as its own published sort of asset
23:42And then because you've now got the ability to run that in Tableau Cloud, yeah, they've got the capabilities to run Python on Tableau Cloud itself, these become very, very portable.
23:52So
23:53Like, this is why I said in the video, wish ten things you didn't know you could do within the video.
23:57Yeah, right, yeah.
23:58Because you could really push the limits of like
24:01What is the craziest data model connection we can create that like touches on so many different things in in one go?
24:09Um it's wild.
24:11Yeah
24:12Um front.
24:20want a lot as well as what if I then wanted to add some role level security to this?
24:26It's not the greatest thing to show that, but what we could do it by just so we're don't keep introducing new concepts, is let's just do it by genre, right?
24:33So
24:34Um let's say uh we I've got this super simple um entitlements table, right?
24:40Um which just has um what I can see, hopefully that's who I signed in as.
24:45Um um yeah, and what'd be neat is I'm on a beta site, otherwise
24:49I was going to use uh prep and maybe didn't even need prep, but use the admin insights data source to that you get natively to be able to do some of this.
24:59It's just they don't give you that on the beta site.
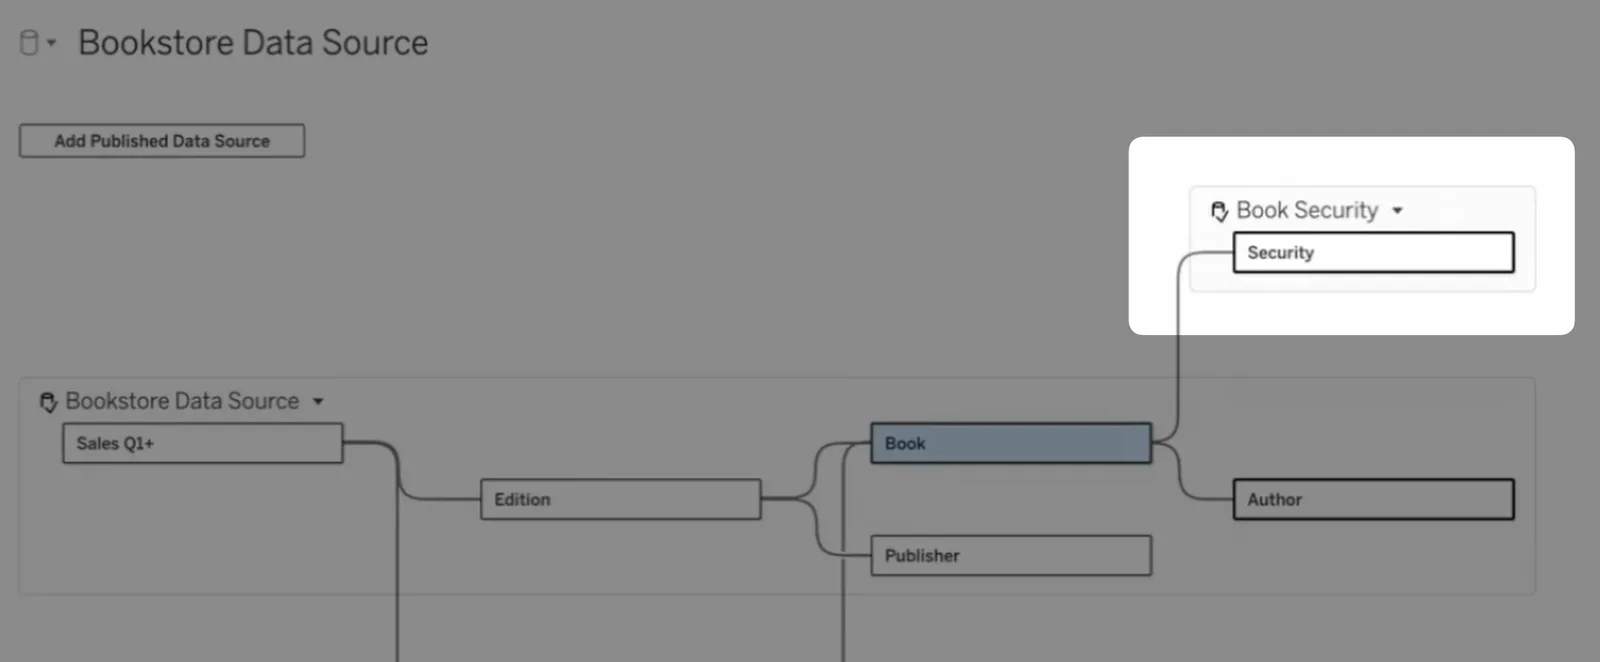
25:01Um so but here's like so I took this and I also created it which is simple, you know I just created
25:09this book security um on top of it.
25:12But all the book security is, is it's it's a live connection.
25:16You'll notice
25:17um that yeah we might run into a problem with that.
25:22But it's um uh that I that I kept it live.
25:25It's not a right.
25:27So what happens with this um is what I should be able to do
25:31is I should be able to also without messing up this person's model, right?
25:36So remember, this person, whoever created this
25:39um which you and I certified might not want world level security on their application of that model.
25:45But in this workbook
25:47We might want it and kind of at the data source level of the workbook, which will make sense in a second.
25:52So if we if I came here and I searched for um security
25:59Um right, so I get this book security, and this is pretty slick for anyone who knows how user functions work in work in Tableau.
26:07Um by the way, this would be um
26:10If you were using an MCP Tableau MCP with this as well for fun, um that uh and you're using personal access tokens or you're using j uh JSON web tokens with embedded applications, it I it would also hold all this.
26:24Like I've tested that.
26:25Right?
26:26But we could go, so what I want is because genres and book, I'm gonna go like this again, right?
26:31And then so all I have to do is create a relationship.
26:36um based on genre, right?
26:39So I called it genre in this.
26:40Did I call it the same in this?
26:41I picked a word that's too hard to pronounce.
26:43But uh you're basically saying if I'm a manager and I look after this genre, this is going to apply a model that will mean that I can only look at my genre in this entire data model.
26:56That's sort of the idea, yeah?
26:58Right, completely.
26:59Perfect.
26:59So if I come in here, um you'll notice that I get I get these seven lines or whatever it is, seven, eight, w eight lines, right?
27:08I get eight lines for genres on sale, right
27:11If I come back here now and I say of course it decides to get slowness now.
27:18So what I want to do is I want to create um
27:22I can create a calculated field here, right?
27:25So what I could do is um I could do this in the workbook too, but
27:30I could go create calculated field.
27:33Weird to do it from there.
27:34But I'm gonna call this row level security, right?
27:37And all it is is uh username
27:42Which is a tableau function equals I think I called it email.
27:46I called it name oh I called it name I think
27:49It's good to know your data models.
27:51Right, so if it's equal to the field name, right, so there it is, right?
27:56Um
27:57Then what I do is I come up here, so I have a calculated field now and it's a filter, right?
28:02So I come up here and I add a filter and it's RLS.
28:07And right now it's gonna set to true if that works, because I'm the only one signed in.
28:13But normally you would only get false, right?
28:15So you would have to
28:17Um you'd have to go custom value list and go type true just for people who are trying this out.
28:23But I'm gonna be lazy and select from list and say true, and I'm gonna go okay.
28:27Oh yeah, and the other key thing is this is important
28:30I want to scope it to say I want it to affect the security table, but also all other tables.
28:36Right.
28:36So when I do this, and if I publish this and I don't let other people author it, if that worked, when I come here
28:43what you're gonna see is that I can only see updates, there you go.
28:48Nice.
28:48All right.
28:49And if I came back here and went
28:53Like that.
28:54I didn't even test this first, but and then I came back to uh here
29:00Right.
29:01And then I refresh the data.
29:04I guess there's a number of ways to do that.
29:06If I refresh the data young adult.
29:09So that's like that's lo
29:11That is live against a not that I'm suggesting you keep Google, but like it shows how that's not in the original model, but I can even add.
29:21row level security that way.
29:23I'm surprised that even works to be briefly honest.
29:26Yeah it's pretty cool, right?
29:27Like why can I see children?
29:29I would expect some sort of lag and some cash to to to like
29:33Yeah, but it's almost instantaneous.
29:34But of course it's not.
29:35Each time you use the line set.
29:38Yeah.
29:38Right?
29:39So and again, so the rest of it's an extract.
29:41All the other things were an extract, and this was a live.
29:48That is that is wild.
29:50Yeah, so it's um and then the last thing I wanted to show is again we're taking genre and killing it to death, but imagine we had
29:59Sales targets like this.
30:00So this is the quintessential I had to use blending to do this, right?
30:06Because someone gets these sales targets for books and they don't own the data source.
30:11So they have to do a blend.
30:13And the other thing y you'd have to do is pivot this, right?
30:16Because Tableau hates data this way.
30:19But because I
30:20Um we could m I don't know if we can pivot a Google source or not, but but I'm gonna pick a simple there's way better use cases than this, but I'm what I'm gonna do is I'm signed in as me and like not my
30:33That account.
30:34Okay.
30:34So what I could do is now what I can do, which I think is really powerful, is I could I can use Tableau Prep effectively with relationships now.
30:44Perfect.
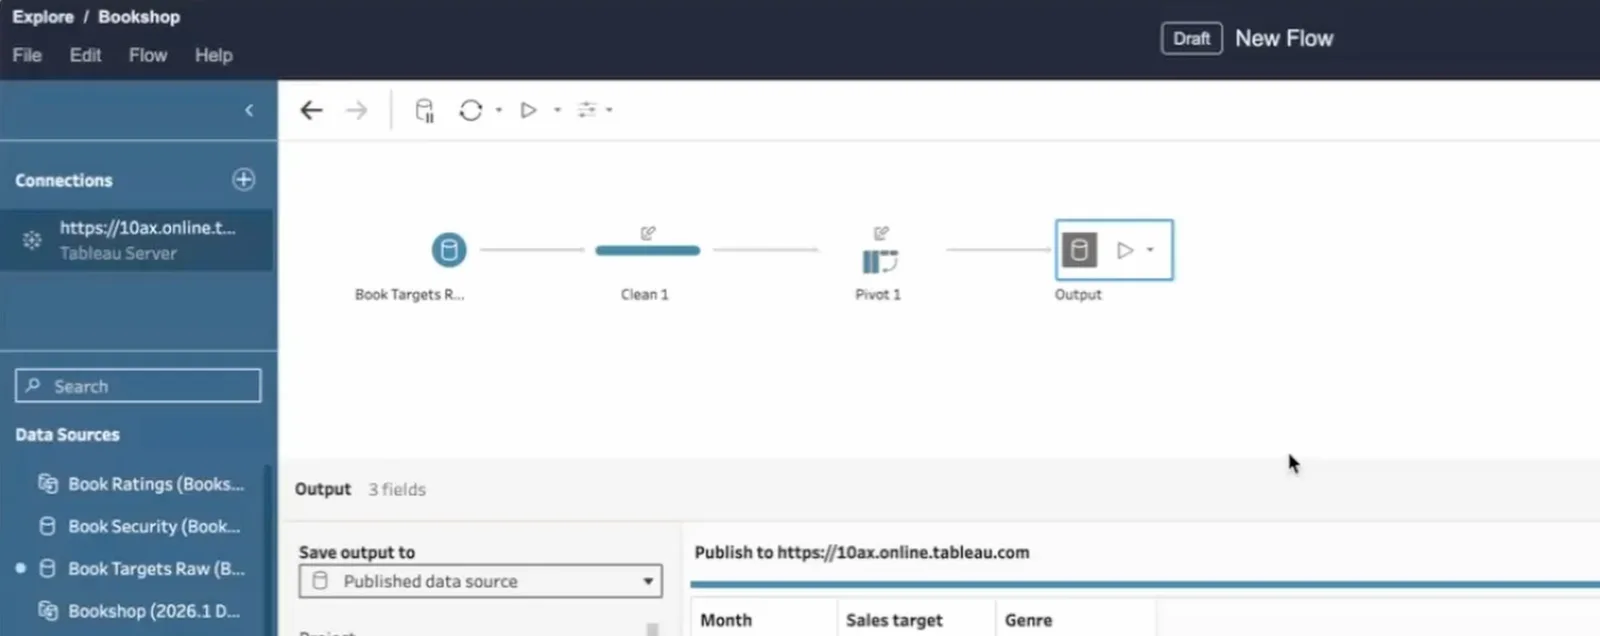
30:45So new flow
30:46Alright, and then we're gonna connect to data and this time we're gonna connect to Tableau server.
30:53And then block targets raw and uh
31:02There you go.
31:04There it took a second, right?
31:06And then uh I still need that clean step because I intentionally didn't clean up
31:11Momrew.
31:14And then I should rename that step, but we've been taking a while.
31:18Columns to rows.
31:20I realize this is faster now anyway.
31:26All right, so this is
31:29uh month and this is uh sales target right and then genre perfect uh
31:37And then I'm going to do an output.
31:40And again, we're going to output to a published data source to our book.
31:43And we're going to call this
31:46uh targets uh clean.
31:50Okay, and I'm gonna run that flow and it shouldn't let me which is fine.
31:54And I'm gonna call this book target flow.
31:58And I'm gonna publish it.
32:00It is a beta as well, so we should we should be forgetting.
32:03Yeah, I we are yeah, we are in the beta site, so it could be it for sure.
32:07Um now we can go back here and see our flow should appear
32:14And then if we click on our flow, but the cool part's coming, did that run?
32:19Uh pending run.
32:21Um
32:22So anyway, yeah, I just wanted to show, you know, you could imagine there's lots of like cases for prep that are a lot more complex than this.
32:31And it was always a frustration before because you could never bring um you could never bring it in, right?
32:37Which was Yeah, because the end state was the was the final thing, right?
32:43But now
32:45Yeah, you could have three outputs out of a prep flow, then go build your data model off that.
32:51Um which was it was something you wouldn't have done before.
32:56Right.
32:56So what we did was we took um we took uh uh it was call center data, like at the transaction level.
33:05Right.
33:06We cleaned it up a bit first and then put that out as a kind of drill down flow, like captive that grain.
33:12Yeah.
33:12But brand forked it.
33:14went up, aggregated it so we could get a and Tableau Prep so good at this.
33:19Um it'd be worth a video on its own.
33:21It like it um we took
33:24Um we said uh you know ag it to the month level of call resolution rate, and then by manager by month
33:32rank each employee right on that resolution rate, which is so complicated and desktop and slow.
33:38And then we just brought it in did a bump chart and then when you click it filtered the other data source which was the exact number of calls
33:46So it could handle that level of data because it was always filtered first.
33:49Yeah.
33:50Right?
33:51So again, like you said, it was a fork a fork flow, which made a lot of sense.
33:55So
33:57We were in here, right?
33:59So now just to recap where we were, we added security, we added dates, uh, so that we could do checkout compare, right?
34:07Um now what we want
34:09As we also want targets, so we could put this it um we could leave this for people as a as a fun uh takeaway uh targets cleaned.
34:22Um because
34:23We could either put this, I think it's going to work either way in this case.
34:28We could put it as a base table, right?
34:31But I don't think I don't think we need to.
34:33I think we could say
34:36Like keep it in one kind of tree.
34:38We could go like that.
34:39Um based on genre, you know what we probably can't
34:44Because what we want, let me go back.
34:50I'm changing my mind on this because we wanted to share both genre and date.
34:57Right, so we can compare across dates, right?
35:00So if I bring this up a little bit, we can go genre from the extract, genre from here, and this also would let us
35:10Um this also we could have had uh if we put it out here and we also had targets in the same file for checkouts, it would have worked, right?
35:18Um and then we can take dates like this, and this one's gonna look more like the checkout one because
35:24Um we only have month level targets, right?
35:26A little little bit of a cheat cause here what we want to do is um
35:32Uh oh I should have converted that first.
35:36What's the um uh this'll test my tableau skills.
35:39So what is it?
35:40It would be date name.
35:42What what is it getting from?
35:43Is it date?
35:44Because
35:45It's called let me do this again because on this side I like it's the month name or whatever, right?
35:53January.
35:54Okay.
35:54Right.
35:55So I does this work?
35:56I think this works
35:58Yeah.
36:00Does it like that?
36:03Uh it should take a date.
36:05It didn't like it.
36:06Yes it did.
36:07Okay.
36:07Yeah it did.
36:07So now if we went to a new sheet, what we should be able to do if we were to say put genre on
36:13Oh again, roll off of security is still being applied.
36:17All right.
36:17Um and uh so that'll pass through the whole thing, right?
36:21And so now we could take
36:23our sales count and we could take uh date I guess I could not drop it like a noob and I could drop it like this.
36:33Um
36:34Right, and then uh d discrete and continuous are gonna be the same in this case.
36:39Uh and then uh where do targets go?
36:42You know you can now search T target uh to the top?
36:49Did it not come?
36:50So right at the top.
36:52Why don't I say that?
36:53Oh no wait that's author.
36:54My bad.
36:56Oh.
36:57My because it's prep?
37:00Anyway.
37:03Anyway, I'm sure this will get better with time.
37:06But but there's my sales target
37:08Right.
37:08And there's my sales versus target.
37:10And now we could do a calculation.
37:12Right.
37:13Yeah.
37:13Pretty quickly and turn into a heat map or whatever.
37:15So I'm not doing a full tableau demo, but you'll see we could compare it to like
37:19Yeah, color coded or whatever.
37:21But now we brought targets in from prep, right?
37:24Or before we would have had to do that
37:27like is a blend and it would have been an absolute mess.
37:29So um yeah, there it is.
37:31So I you know, kind of what we built, again we could view our data model this way, right?
37:36Again, and really show this is neat, but we started with this data source.
37:41And we didn't have to go back to that person, right?
37:44And we didn't mess up any workbooks with that in it, right?
37:47And then we brought all these other things in.
37:50And now we could always say
37:52Uh you know, given the view we're looking at, what fields are we using and I don't care about the hires.
37:56You know.
37:57So but it and I do think what in time they will come with is
38:01This is modal, so it's hard to show sharing one screen, but in desktop it would pop.
38:06If we highlight a field, or say we did that field to compare, um, it would highlight the tables it came from.
38:13But I do think the the goal they have is to get like a a prep like interface to show what the join is too, which would be pretty cool.
38:19Yeah.
38:21I think that'll come in time.
38:23But you'll see we built that.
38:24The only thing I would end with is we could have
38:27Um if we were back, doesn't matter.
38:31So if we were um Yeah, I don't love how you exit that.
38:36Um if we were back, say here
38:38I did we built that effectively like an embedded data source, right?
38:43We could have created a new published data source, which might make sense again for something like your VisQL
38:52Data example or whatever, right?
38:54So we could start with bookstore, right?
38:57Or bookstore data source.
38:59I'm not gonna rebuild the whole thing, but you get the idea that we could come back here
39:03add a published data source and then publish the new data source which is like you know the superset of those data sources and then people could use that data source
39:12without having to do it.
39:14But that but that's why I love it both ways, right?
39:16So I we could make it that way.
39:18So, you know, we make it available to agents or FISQL data service or just people in general.
39:23Or
39:24people in the flow of their work could do this, right?
39:27So my early thoughts are now, you know how people all especially with prep being brought in.
39:34Um say you can only use PrEP, but your job's now becoming kind of like an analytics engineer, but not a full-on one.
39:41You still don't have to know how to write SQL.
39:43Now what you could do is you could do
39:44um fact tables, so effectively you know tables with r with raw kind of transactional data in them.
39:51Then use prep to create um aggregate tables and still have cleaned up dimension tables
39:58And if you train people the right way, they could compose their own data sources.
40:02And this age old, well, if I aggregate my data, I can't get to the level I can't drill down to the detail I want.
40:08But if I don't aggregate it, my dashboard's really slow.
40:11Well now
40:12Put both of them in the same data source and you don't have to make that trade off anymore.
40:17So interesting.
40:18Yeah, that that's why so that's why I've been s even more excited about these
40:22after I saw them was this whole, you know, I'm in my flow of work.
40:27I don't have to get out of my flow of work to be able to do even crazy things like well not crazy, but
40:32advancey things t from a business perspective, not a technical one, like adding road level security to an existing model or bringing in sales targets or
40:41Yeah.
40:41So I thought I thought that kind of captured the use case pretty well.
40:44It's very good.
40:45Yeah, it's a it's a crazy time um to be alive, as they like to say.
40:51It's this is um
40:53I had not anticipated it to be this flexible and I guess maybe it makes sense why it took long because I thought what was taking long was the more simple version.
41:02where you had to sort of scope how these two big entities come together but actually this is far more flexible and it
41:10Yeah, you're totally right.
41:12If you use this irresponsibly, you will create very inefficient workbooks
41:18But that's always been the s that's always been possible, right?
41:21You know, people do weird things with with the custom sequel and all that jazz and Tableau's never stopped you doing that.
41:26If you can, it will let you.
41:27Um that still applies.
41:29Um but yeah
41:31Very good.
41:41Is an independent query tree that uh Tableau is gonna run and if you have a calculation in a view or both in the view from these that it's gonna
41:53effectively do a coal s query in memory in the view to do that.
41:58So you could if you weren't careful and tried to get too atomic with it, um you might end up with so much data that the thing's gonna
42:06Uh I think of it.
42:10Yeah.
42:10Yeah.
42:11Your database doesn't get hit with the SQL that would have been generated from this, which is kind of nasty.
42:17Well, I think the point is that I'm not sure your d your database could get it from a couple of because even if you pushed it down
42:26Yeah, if it was live it might be okay.
42:27You'd have to push it to snowflake, but you still have to get the results out at the right level of grain to stitch it together in memory.
42:45Almost doing it client side means your database doesn't have to like, you know, brunt the load, but also Table can do it more efficiently because they know what's in the view, they know what's actually required, it doesn't have to
42:56Query the whole thing even if you're gonna bring back columns you don't need for that specific view or sheet.
43:02Yeah, I guess we should be clear in that if they were live, if this was live and not extracts.
43:07Um I think it would push the query down, but the part that always is gonna happen in memory is because these trees are different
43:15Correct.
43:15And and it's hard for databases to do those and to model these.
43:19I think this is um it I I yeah, there's not a lot of products that do this well, I don't think.
43:25To be clear.
43:26This is a live connection to published data sources.
43:30Right.
43:31Which in themselves might be extracts, right?
43:34Yeah.
43:34Yes, a hundred percent.
43:39It's like
43:40Right.
43:40The way it's querying these data sources as it as tablace is that is a live connection to these published data sources.
43:47You could also have a Google Sheet that is connected live, or you could have, let's say, another thing which is not.
43:55live it's an extract but this whole this this live extract toggle at the top applies to this whole uh picture that we see so when when you hit extract
44:05it at least in this view, it would go and download I don't know how many tables, one, two, three, four, five, six, seven, eight, nine, ten, eleven tables, um, save them separately in the way that it stores this data model.
44:15And then
44:16When you actually use the workbook, it queries them based on what's in the view, basically.
44:20Yeah.
44:21It it's confusing for sure.
44:22So you'll see because I'm on the web, I can't extract it.
44:25You can't extract it, yeah.
44:26But if I if I were in
44:28desktop and I extracted it.
44:31It would actually extract it would take a snapshot of it as a bunch of iPhone.
44:35And it confuses people because then you would have to republish that data source explicitly to get it.
44:41So I wish they kinda had.
44:43I wish they had luckers.
44:45Um they had live extract as this and then published connected to a published data source or something.
44:51Right.
44:51Yeah.
44:52Because here it's not c it's only that I know that these tables are all extracts and this is a live
44:58Google Sheet.
44:59But it's not clear at all, right, looking at this.
45:01So I mean there's things they couldn't prove for for sure.
45:04We're gonna keep them in
45:05I'm gonna keep them employed.
45:07But but it is uh but I mean it's the it but the but the actual UX of it I really really really liked because I can stay in my flow of work, which was cool, right?
45:16Like this is
45:17Like I mean it is pretty neat to go, all right.
45:20I need to see like uh all the targets, right?
45:24If I like literally all I have to do is go like that.
45:27Right?
45:28Go um go back to this and if I were to refresh this, um, yeah, I'm gonna see like pretty much instantaneously
45:37It's just it's a web app so it's stateless, but um Of course now it doesn't.
45:42No.
45:44Are you kidding me?
45:46It did it earlier on.
45:47Everyone saw it, don't worry.
45:48Everyone saw it, yeah
45:50Uh was it something about the order I built that in or something?
45:53Anyway, yeah, it Maybe the session's just out of luck.
45:57Maybe the Google Sheets session doesn't persist 'cause I think we had this before.
46:02Do you remember?
46:03Um Yeah.
46:05I think the Google Sheet session stays active and beyond that it wants a new like session token or something like that.
46:12That could be what it is.
46:13And I didn't embed my token.
46:15I don't know if you know, so that's why I thought I might run into complete problems with it.
46:18Because it's I didn't embed it in the connection.
46:20So Maybe when you publish it up that will force a refresh.
46:24Yeah.
46:25Or I should
46:27Yeah.
46:28You know what I mean?
46:28Sorry.
46:29Back here it back here should definitely say lives.
46:31Yeah.
46:32I had to push it too far.
46:34Amazing.
46:35That's so cool, Kirk.
46:36Listen, Kirk, thank you again.
46:38It's been an absolute pleasure.
46:39Um I think this is going to be a great little um addition to our data uh model masterclass.
46:46I I I feel like I have to um we have to pencil in the like ten things you didn't know you could do with a tableau data source kind of
46:55uh thing, let's build like this one mega connection which does ten things that you didn't know and then publish them all.
47:01You know, your your Google live query things blew my mind in this context because I was like
47:06Wow, like if if you take that and just really run with it, like what crazy thing could we build in one
47:14composable data source, right?
47:17Yeah, that'd be fun to do.
47:19That'll be fun.
47:19Let's do that at some point in the next few months.
47:21Um I'll start penciling some ideas and then we'll build out the use case and we'll do it.
47:26Nice, awesome.
47:28Thanks again for having me on.
47:30Cheers.
47:30Take care.
47:32See ya
 Tableau | Data visualisation | Data prep | Tool strategy