Tableau | Tool strategy | Data visualisation | Data prep
 Tableau 2020.2 feature roundup in under 10 minutes
Relationships, metrics, Ask Data upgrades and a dozen quality-of-life fixes — here's everything new in Tableau 2020.2.
- The new data model introduces relationships, reducing the need for joins, blends and complex LODs
- Metrics let users build and save their own analytics from any visualisation, accessible across desktop, mobile and Online
- Sets gain a filter-like set control and the ability to add or remove items by interacting directly with the chart
- Tableau Prep adds incremental refreshes and a native Salesforce connector, removing the need to publish via Server first
- Ask Data gets data roles, editable custom suggestions and support for data sources built on the new relationship model
- Intro and webinar announcement0:00
- Desktop: new relationship data model0:30
- Metrics feature1:08
- Set control and incremental set editing1:36
- Esri web data connector and device designer2:16
- Tableau Prep updates2:55
- Tableau Catalogue and data quality warnings3:42
- Publish workbooks without opening them4:43
- Ask Data improvements5:07
- Oracle spatial support6:06
- Quality of life improvements for users6:19
- Server admin and API improvements7:56
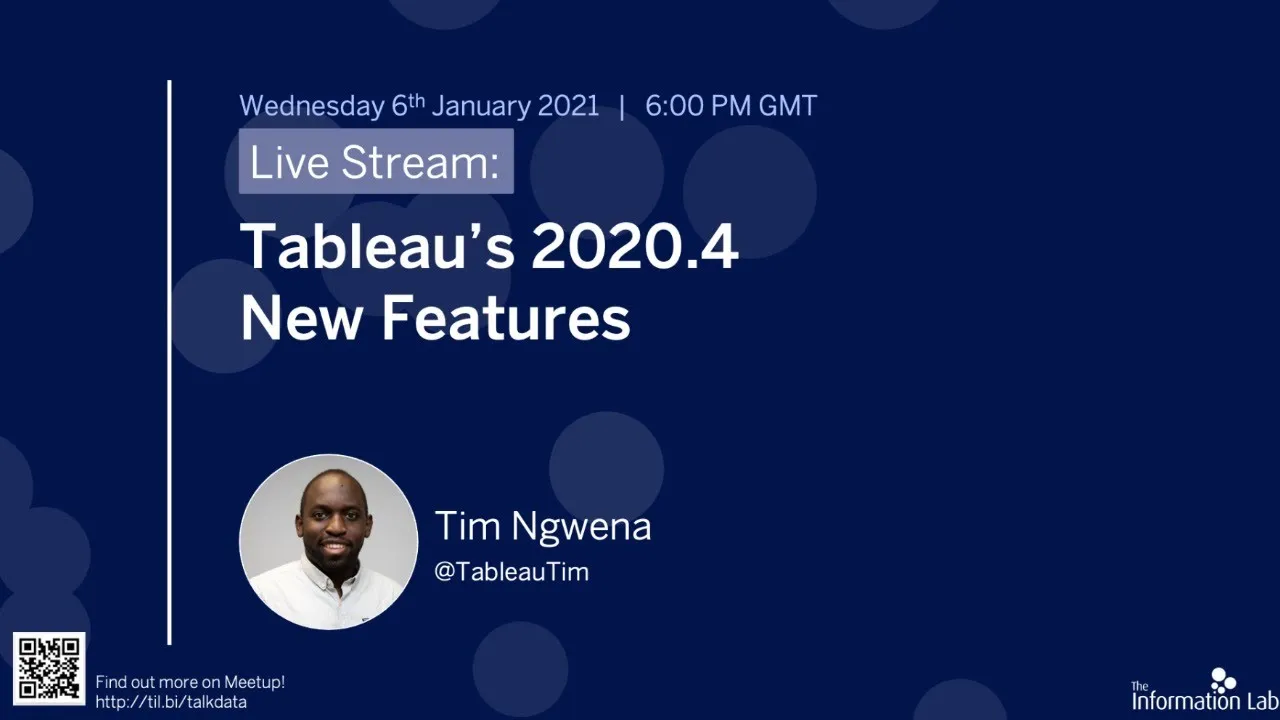
0:00Hey, my name is Tim and I'm from the Information Lab.
0:02And in today's video, I'm going to be doing a quick roundup of all the new features in Tableau 2020.
0:082.
0:08But before I get stuck in, I just want to let you know that starting next week, every single Wednesday, I'm going to be doing a webinar on all the new features.
0:16So don't miss out.
0:17You can find a link below to join those webinars
0:19Or you can just go to our meetup page, that's meetup.
0:22com forward slash let's talk data.
0:24It's on the screen right now.
0:25Head there straight, book into one of those webinars, and I'll see you there.
0:29Okay, we have a lot of features to get through, so let's start with Tableau Desktop and the authoring experience.
0:35One of the biggest changes in Tableau 2020.
0:372 is undoubtedly the data model.
0:40The data model introduces a new concept called relationships, which put simply allows you to define relationships between datasets.
0:48And then Tableau can then use these relationships to make it easier to work with your data, making it less likely that you'll need to join, blend, or even do weird LODs to get things to work correctly
1:00Check it out.
1:01There's no way I could explain it in this intro.
1:03So just go check it out, catch it in a webinar, and get involved.
1:07The next feature is metrics.
1:09Now metrics are just a smart way to let users build their own little forms of analytics on the go and on the fly on mobile devices.
1:17What a user can do is they can go to any visualization
1:20Choose a metric and then create their own metric from that perspective and then save those on Tableau server in their favorites like any other asset they would in Tableau.
1:30and from there they can access it on their mobile devices, desktop, mobile and even Tableau Online.
1:35The next set of improvements comes to sets.
1:38Now sets get two features
1:40in Tableau 2020.
1:412 broadly around user experience.
1:43The first is a set control.
1:45This essentially allows you to have filter like controls
1:48for your set so you can add and remove items from a set using a filter light control.
1:54Drop downs, single value drop downs, you name it, it's all there
1:57The next improvement is the ability to add and remove items from a set, incrementally, just by interacting with the data on the chart
2:05Check out this feature.
2:06It's really, really hard to get your head around, but hopefully you've caught some of Lindsay Poulter's great content on this already.
2:12If not, head over to Twitter.
2:13It's up on the screen right now and check it out
2:15The next update is a new web data connector for Esri.
2:19Quite simply, this lets you connect to Esri web Data Servers directly using a web data connector that Tableau have built
2:26for you to use in their software.
2:27It makes it super easy to start working with spatial data even faster than before.
2:32And if you use this quite frequently you can start to use this to
2:35Do anything you want, especially bearing in mind that you can use this alongside existing data capabilities like cross-database joins and the new data model
2:45Last but not least in desktop, we have an update to the device designer lists.
2:49So you now have devices like the iPhone 11 Pro available for preview when you're building for mobile.
2:55Okay, let's turn our attention over to Tableau Prep.
2:57Tableau Prep gets two features in this release, which might not sound like a lot, but here's the thing.
3:02Tableau Prep gets features nearly every single month, so stay tuned for more features.
3:07during the course of the next three months.
3:09But first we have incremental refreshes.
3:11These work exactly like you'd expect in Tableau Desktop.
3:14It essentially allows you to run portions of your Tableau Prep Flow, only updating the new fresh data that's available in your data sources.
3:21The next update is a Salesforce connector.
3:24This already existed in Tableau Desktop, so you could have previously published up your data to Tableau Server and then connected
3:31to Tableau prep, but this removes that step.
3:33You can connect directly to Salesforce and it works exactly as you'd expect.
3:37Your Salesforce objects appear and you can start doing data prep on them really really fast
3:42Now next up we have an absolute truck ton of features specifically for Tableau Server, Tableau Online, and the mobile experience
3:50The first two are focused on the Tableau Catalogue.
3:52Now the Tableau Catalogue was introduced to make it easier to understand what's going on with data on your Tableau server or Tableau Online environment.
4:00The two improvements are specifically around making it easier to find data sources that have been published when you connect to them in WebEdit or in Tableau Desktop.
4:09The next feature allows you to view dashboards in the lineage so you can actually see which data sources and which dashboards are impacted
4:17by specific changes across your entire organization.
4:20Staying on the topic of data quality, you've got high viz data quality warnings.
4:25Now, you could already previously add data quality warnings to your datasets, but this feature makes them highly visible.
4:32So anytime a user uses a visualization that is connected to a data source with a warning
4:36They'll see the warning really really clearly and they can then ask some questions and see what the issues are.
4:42The next feature is my personal favorite.
4:45You know when you want to publish up a workbook but you don't want to open it, but you have to because that's the way it's always been?
4:51Well, fear no more, that's changed.
4:53You can upload a workbook directly to Tableau Server or Tableau Online
4:57It's very very simple, it works just as you'd expect.
4:59There is a limit of 50 megabytes, but otherwise you're pretty much good to just upload any workbook without having to open it in Tableau Desktop.
5:07The next three features are focused around RSData.
5:10Now R Stata is a powerful feature because it allows anyone to just type natural sentence into a search bar and get visualizations in response
5:18The first feature they've added here is data roles.
5:21Let's say you have synonyms or specific data types that you assign to data sources quite often or to specific field quite often.
5:28Well you can now save this as a data role.
5:31Save it in any project and then apply them to other data sources that might have similar fields.
5:36This just streamlines the work of adding synonyms and metadata to your data
5:40The next is the ability to add and edit the custom suggestions.
5:43You often see suggestions from Tableau on questions to ask.
5:47Well you can now edit these.
5:48And it's much, much easier to then have meaningful questions readily available for users to understand how the feature works.
5:55And the last feature isn't really that new.
5:57But of course with the data model you want to be able to ask data with data sources that have been published using the data model.
6:04So that's now supported.
6:06The next feature is support for Oracle spatial objects in Oracle databases.
6:10This is quite simple.
6:11Previously you've been able to connect to spatial data source in other databases, and now Oracle is one of those databases
6:18That's it.
6:18The next set of features are mostly quality of life improvements.
6:22The first is the ability to manually reorder your favorites.
6:25I can't believe this hasn't been a feature already.
6:26You can basically change the order of your favorites
6:29and they persist wherever you go even if you filter the view or even on your mobile device.
6:34The other little niggle they're fixed is the exports of a crosstab.
6:38Now previously what you had to do is you had to select a sheet and this wasn't obvious for users.
6:43So now you don't have to do that.
6:45You can simply hit the crosstab export button and you'll get an interface asking you which sheet you'd like to export data from.
6:52Now.
6:52If you're like me and you don't name your sheets, the reckoning is here.
6:56You're gonna have to start naming your sheets.
6:57Otherwise, the user is just gonna see sheet one, sheet two, sheet 130.
7:02It ain't a good look.
7:03A new feature is the ability to use the keyboard to access your parameters.
7:07Essentially, if you go to any visualization and then you hit tab,
7:11You can move through all the interface items on your tableau dashboards with just your keyboard, no mouse needed.
7:17This is a great accessibility feature as well, so those who are impaired and can't use a mouse can just use the keyboard
7:24To access their parameters.
7:25You can also nudge the parameters and change their positions by hitting up and down on the arrow keys, and that's it.
7:31That's a pretty simple feature and it's a great update.
7:34The last quality of life improvement is for data sources
7:37You know when you publish up a data source and it's got an automatic refresh on it, well sometimes the user doesn't actually see the freshest data.
7:44So what they've done in this version is they've changed that behavior.
7:47From now on, every time a refresh has been done on the data source, the cache will be cleared and every single user will see the latest data.
7:55The last set of changes are quality of life improvements, mainly targeted Tableau Server Admins and developers through the APIs
8:03My personal favorite is the updated admin schedule, which makes it much much easier to choose a favorite schedule for your organization.
8:10The next is a prefright checklist.
8:12This simply checks that your Tableau server is
8:15Good to go before you run an install or an upgrade.
8:17It sounds simple, but now it's a feature.
8:19These are just a few amongst many more improvements to make it easier for admins to control and manage Tableau Server
8:26Okay, that's pretty much it.
8:27That's me done for today.
8:28Join me next week in the first webinar where we'll be going through the desktop features and Tableau Prep.
8:33It's going to be an absolutely great webinar and live stream.
8:36Join in and I'll see you there
Time Stamps below… In this video, Tim takes you through the headline features of Tableau 2020.2 in under 10 minutes. Also, be sure to join him on his live streams and webinars every Wednesday in May.