0:00Hey, it's Tim here. In today's video, we're
0:02going to cover Tableau Pulse, which was
0:03announced at the Tableau conference keynote
0:05. Let's get started.
0:07So the easiest way for me to explain this
0:09feature is to sort of walk through it chron
0:11ologically, and I'm going to try and edit in
0:13footage from the keynote in the order so
0:16you can kind of get a sense of how it works
0:18.
0:18As it is today, if you're using Tableau, in
0:20fact, let me hop out of full screen. If we
0:22go over to Tableau Cloud, you can see I'm
0:24just in a normal dashboard, and if I click
0:27on a data point, go up to watch, select
0:29metrics, you can see that we get this
0:31ability to create a metric on the right
0:33hand side.
0:34The problem is, is these have been limited,
0:36they've relied on the dashboard to be
0:38created. And one of the things you got a
0:40sense of at this keynote is that Tableau is
0:42, to borrow a word, decoupling so much of
0:44its analytical stack, so you can choose
0:46which parts of it you want to use and where
0:50.
0:50Embedding is one capability, but metrics is
0:52another. And so what they announced is
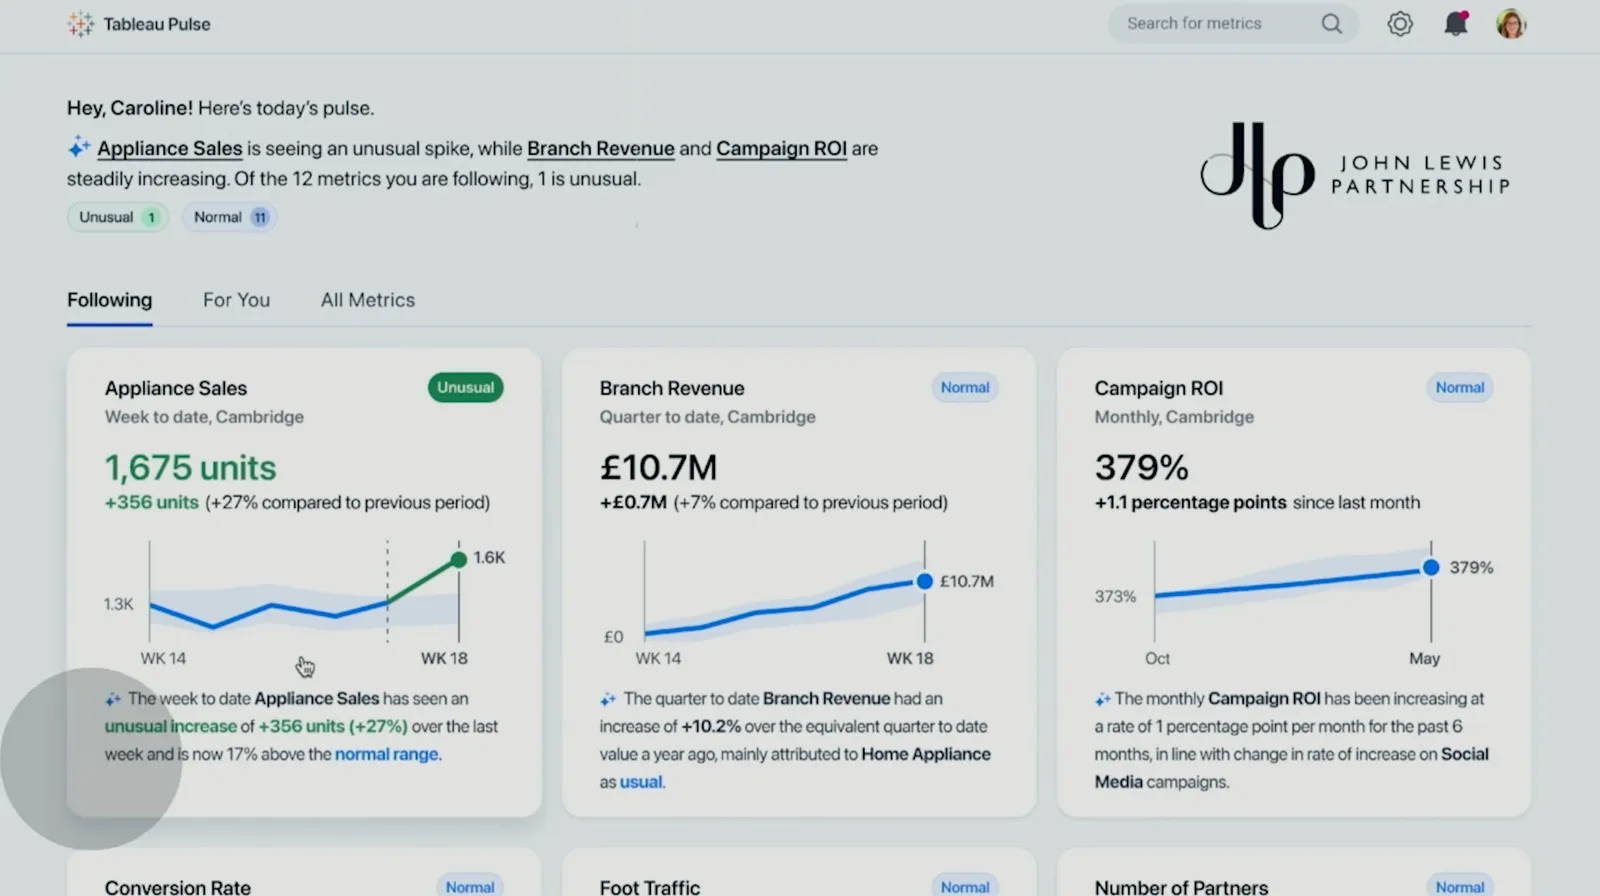
0:54Tableau Pulse. And if I can sort of try and
0:57describe to you what Tableau Pulse is, it's
0:59a range of technologies sort of brought
1:01together. It's a bit of metrics, a bit of
1:05Tableau GPT, which I'll cover in a separate
1:06video, and they've given it a landing page.
1:09And think of this landing page as a
1:10destination for people who typically don't
1:13start their analytical work in a data
1:15source, or these people might typically go
1:17straight to a dashboard and instead of
1:19going to a dashboard, they'll have this
1:21ability to go to a landing page, which
1:23covers the metrics that they're most
1:26interested in.
1:27How do you build a metric? Well, there's
1:29two ways. There's the most simplest way,
1:31which is an author, someone who knows a bit
1:33about the data source, can essentially use
1:35an interface to describe the metrics they
1:37want to build what kind of context, what
1:39kind of time periods.
1:41Once they've done that, that metric or that
1:43whatever we're going to call it, let's call
1:46it Pulse for now, becomes available in the
1:48Tableau Pulse interface. Once there, Table
1:51au GPT technology is able to look at that
1:54particular metric and add sort of small
1:57flares, additional questions, things that
1:59things you should know about.
2:01And it can augment that initial metric with
2:03some more information. That's sort of a
2:05rough guide of how I think it works. I have
2:07to say, I think because fundamentally it's
2:09not been released and what we probably saw
2:12was like a conceptual sort of working setup
2:14of it.
2:15So the really powerful thing here is that
2:17the way the interface is set up for users
2:19to build these metrics is actually quite
2:22accessible, a lot more accessible than
2:24something like Tableau desktop.
2:27And they're also quite powerful because the
2:29thing that I think absolutely everyone
2:32slept on during the keynote was the fact
2:34that these metrics can be embedded in a
2:37dashboard, in emails, in Slack, and also of
2:40course on Tableau service.
2:42So these are truly portable. And the
2:44biggest one is in a dashboard because when
2:46they're in a dashboard, some of the chart
2:48design and some of the way those things are
2:50set up, it's incredibly hard to get
2:52anywhere close to that even neat design.
2:55And if they're bringing that interface to
2:56an author, then this is going to really
2:58incentivize authors to start to use this as
3:00a way of building simple metrics that
3:02people can follow up on.
3:04Now, the other thing is that this
3:05technology is sort of infused with
3:07something called Tableau GPT. Tableau GPT
3:10was also announced at conference. I don't
3:13want to dive into that too much here.
3:15But nonetheless, Tableau GPT is playing the
3:17role of helping people ask smarter
3:19questions. It can do that in a couple of
3:21ways. The first one is by suggesting
3:23questions to you. So you can load up Table
3:26au Pulse and you might see three suggestions
3:28of things you can ask.
3:30The other way you could use this is just
3:31through the search function. So in the
3:33search function, you could type something
3:35in and it might create some sort of a chart
3:36and a story, which then might lead you to
3:38Tableau Pulse. That's sort of another route
3:39.
3:40And then the final route is you can almost
3:41ask an open-ended question. In the keynote,
3:44they showed a demo of someone asking, "Hey,
3:46what else should I know about AirFries?"
3:49And the great thing about that question is
3:50it obviously has context of the data source
3:52. It obviously has context of the open-ended
3:55ness of this question.
3:57And it's going away and finding some
3:58insight that could be pertinent to that
4:00particular thing you've asked, so AirFries
4:03in this case. And it then generated a chart
4:04.
4:05Now, that is a demo. That's sort of its
4:07conceptual way of working. But if it
4:08actually works like that, that is
4:11incredibly powerful because what you can
4:13start to do, I think, in the future is if
4:15you're an analyst, if you're an admin, the
4:18metadata of what's being asked is now an
4:21absolute goldmine.
4:23Because what people ask sometimes is
4:25different to what they tell you they need.
4:28And so by seeing the metadata, you can
4:30start to build a much richer picture of
4:32what data sources you need to go out and
4:35work with, what your data engineers need to
4:37be prioritizing in terms of workstreams and
4:39workflows.
4:40But also, more importantly, are people
4:42asking questions about data sources, fields
4:44, or assets that you don't yet collect? And
4:47therefore, you can sort of stand up the
4:48associated projects to make sure that data
4:50is collected and stored.
4:52So all in all, I thought Tableau Pulse was
4:54a really interesting feature set.
4:57Ultimately, I said in my keynote roundup
4:59that this was Tableau Metrics Unleashed,
5:02and I stand by that. I think it looks
5:05absolutely fantastic.
5:07The closest thing I've used to this is
5:08something called Altrix Auto Insight. And
5:11Altrix Auto Insight, to me, was always the
5:14example I would sort of showcase to people
5:17when people talked about our stated because
5:19the problem with our data in the past
5:21has been it's required you to ask questions
5:23in a very prescriptive way. And it's kind
5:26of coached you. The interface was designed
5:29around coaching you to ask the right
5:30question. Whereas this seems like a truly
5:32open way of asking questions.
5:35And this is sort of the power of GPT
5:36technology, large language models being
5:39trained on the way people talk and have
5:41conversational discussions around analytics
5:43. And now it's available inside of something
5:46like Tableau.
5:47So I think Tableau Pulse is super exciting.
5:49A few key things that I sort of wonder
5:51about, all of this AI technology has to run
5:54somewhere, the training, the learning, all
5:57of that has to run somewhere. And that
5:58would typically suggest that this might be
6:01a Tableau cloud product.
6:03If it's also going to be available on Table
6:04au Server, then I think the genuine question
6:06that Tableau Server admins are going to
6:08start asking is, what are the resource
6:09implications for me? Because AI model
6:12training is not an easy or straightforward
6:14thing.
6:15And if it's the kind of thing that can run
6:16in the background on very small resources
6:19or can run in a sort of quiet time of the
6:20day, then fine. But as these features start
6:23to haul out, you're going to see computing
6:25requirements and minimum requirements start
6:28to step up.
6:29And it might just be that Tableau cloud is
6:30the only way to keep up with those
6:32requirements. So let's wait and see. Anyway
6:34, that's it for this video. Hopefully catch
6:37the next video where I'll talk about Table
6:39au GPT and what was announced at keynote.
6:42Thanks for watching, and I'll catch you in
6:42the next one.
6:43Transcribed by https://otter.ai
6:55[ Silence ]