Build Sankey Charts in Tableau Public in 30 seconds | Tableau Public Vizart Pilot
What if I told you you could draw a Sankey chart in Tableau in 20 seconds flat?
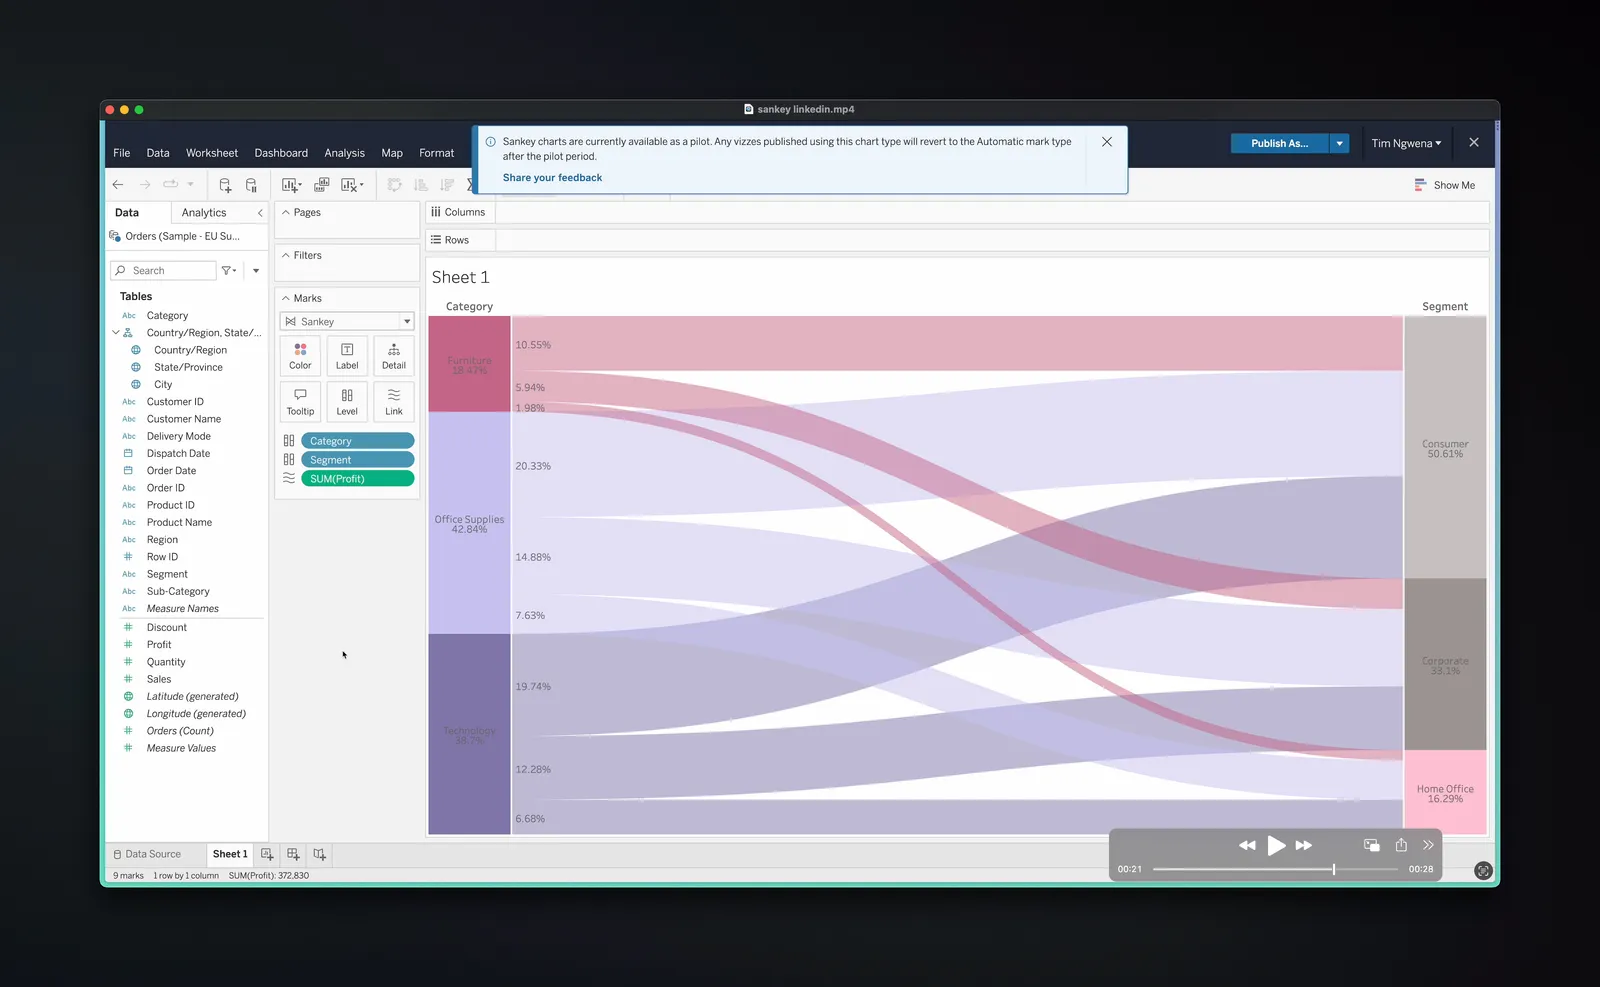
- Tableau Public's web authoring has a pilot feature, available until 30 June, that adds native Sankey and Radial chart types
- To build a Sankey, switch the marks type to Sankey, then drop dimensions (category, segment, subcategory) onto the level shelf
- Drop a measure such as quantity onto the link shelf to control the width of the flows
- The resulting Sankey is fully interactive with the usual Tableau hover tooltips, no blogs or templates required
- Native chart trials appearing in the cloud web interface likely hint at a new approach to adding chart types, which may reach Tableau Desktop
Ever wondered if you could create Sankey charts in Tableau in just 20 seconds? Well, it’s now possible as part of a pilot program available until the end of June. Sankey charts are a unique way of visualizing the flow from one dimension to another and have been quite controversial in the business context. However, in some cases, they can provide valuable insights.
To create a Sankey chart in Tableau Public, follow these simple steps:
- Go to Discover > Create > Select Web Authoring.
- Connect to a data source (the example int he video above uses Superstore Sales, but you can use your own data source).
- Change the marks type to Sankey.
- Place dimensions on the level option in the Marks pane.
- Add a measure to the link (Quantity).
- and You’re done. You can customise it further.
That’s it! You’ve successfully created a Sankey chart. The best part is that it’s interactive, so you can hover over the data points to get more information. This ease of use is what makes Tableau special.
Sankey and radial charts are just two new additions being tested in Tableau Public’s web interface. This could signify that Tableau is exploring more ways to add charts in the future. So, go ahead and try creating Sankey charts on Tableau Public before the pilot program ends on June 30th. And don’t forget to check out the upcoming video on creating radial charts as well!
Timestamps 0:00 Intro 0:12 Background 1:47 Build a Sankey
Join this channel to get access to perks: https://www.youtube.com/channel/UC7HYxRWmaNlJux-X7rNLZyw/join